

Good morning
Starting my daily chart scanning and bitcoin $BTC needs closer attention.
Why?
Because it’s moving and moving higher past a key technical level.
Here are some charts to get you up to speed on perspective.
6 month daily chart here…

The price is rising towards 15,000.
2 year weekly chart here…

You can see that the move above 14,000 is a technical breakout past the summer 2019 high.
4 year weekly chart here…

This shows you the old all-time high near 20,000 back in late 2018.
8 year weekly chart here…
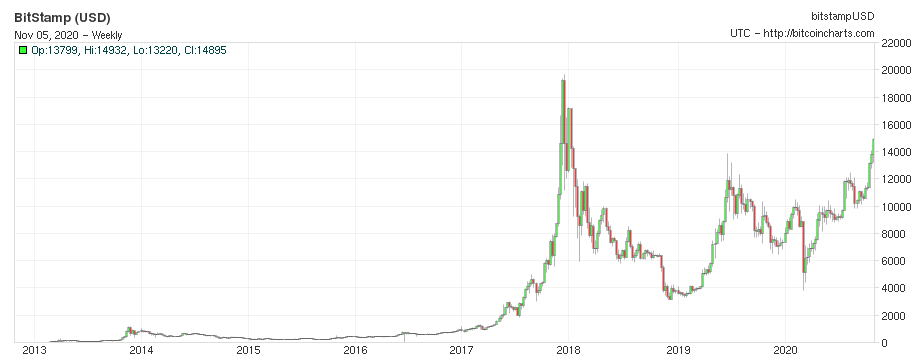
Here you can see the life history of bitcoin $BTC from it’s humble beginnings in 2013.
As the price broke out above 14,000 there won’t be heavy price resistance until we near 20,000.
Also, so many of the holders of bitcoin are not eager to sell or trim positions anytime soon. They want to add!
The banking institutions are starting to show their cards that they actually support bitcoin.
Companies, like Twitter, are showing that they are holding bitcoin reserves.
The fiat currency printers are running hot.
This provides a solid fundamental and technical landscape right now in favor of higher prices. How fast we move remains to be seen.