


It’s been a super busy week at my day job so I haven’t been doing my normal morning market monitoring, looking at charts and getting those shots of fear and greed going along with it ;)
While chatting with a great mentor of mine he mentioned it was a down day for the Dow Jones $DJIA
So, sitting at my desk, wrapping up my week I thought that I’d take a peek at the action.
Whoa!
As anyone with eyes can see, it was a big red candlestick day in the 6 month daily chart here

I took an immediate look at the 2 year monthly chart here
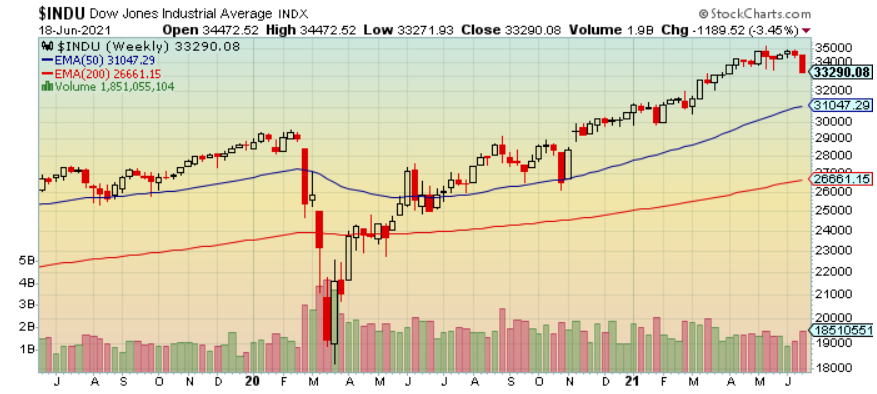
Looking at the 200 day EMA on the daily at 31,505 and the 50 week EMA on the monthly chart around 31,047 you can see the next two obvious areas that price support might appear.
Who knows the market mood after the summer weekend.
Heck, who knows anything anymore ;)
BONUS
Here is a look at the Nasdaq $COMPX 2 year daily chart.

Hmmm…
…might that be a triple top in the works?
Have a great summer weekend. Summer is better!
Kindly, BG